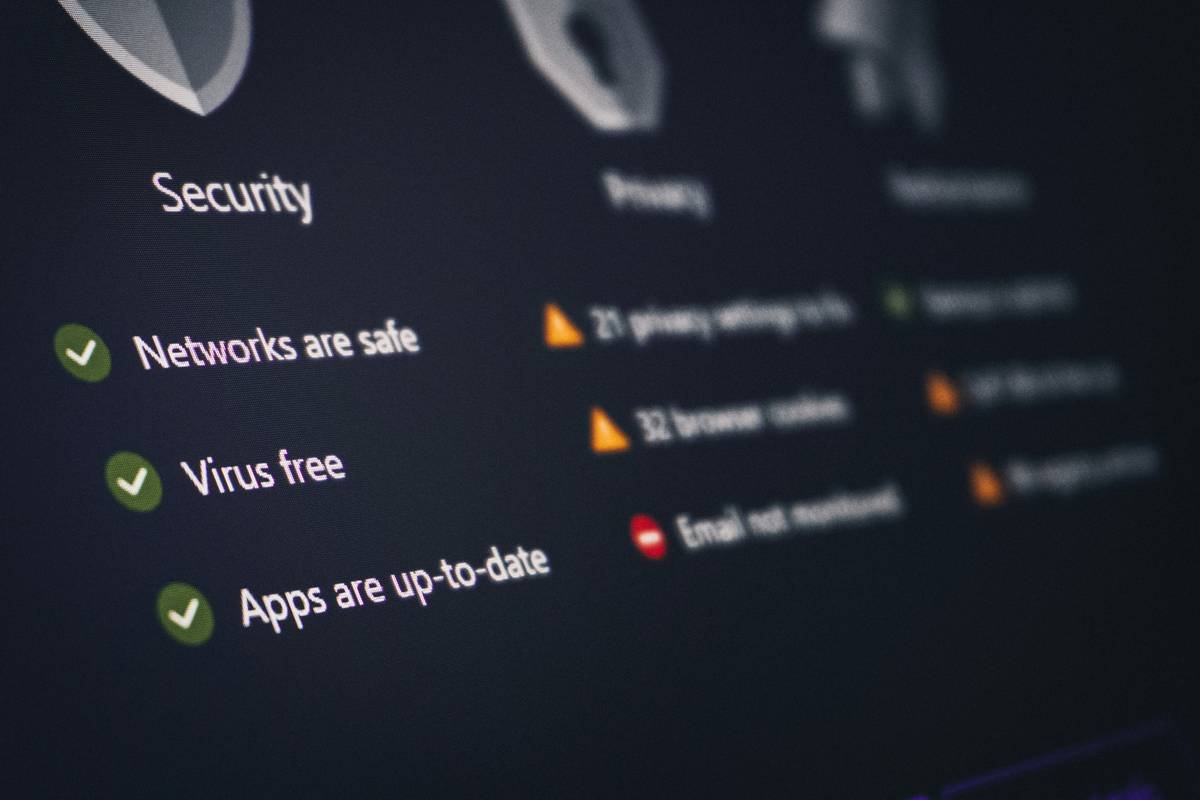
Ever feel like your cybersecurity dashboard is doing more harm than good? You’re not alone. In 2023, IBM reported that the average cost of a data breach hit $4.45 million—a 15% increase over three years. Yet, countless security teams drown in dashboards that scream “alert!” while missing the real threats hiding in plain sight.
This post cuts through the noise. We’ll expose why most cybersecurity dashboards fail, how to build one that actually works, and what top-tier SOC teams do differently. You’ll walk away with actionable steps to transform your dashboard from a flashy paperweight into a precision threat-hunting instrument.
Table of Contents
- The Dashboard Delusion: Why Pretty ≠ Protective
- Building a Truthful Cybersecurity Dashboard: Step by Step
- Best Practices for High-Signal Security Views
- Real-World Dashboard Disasters (and Wins)
- Cybersecurity Dashboard FAQs
Key Takeaways
- Most cybersecurity dashboards suffer from alert fatigue, poor data context, and misaligned KPIs.
- A functional dashboard prioritizes asset criticality, user behavior baselines, and threat intelligence integration.
- Top-performing SOCs use dynamic thresholds—not static rules—to reduce false positives by up to 70%.
- Never trust a dashboard that doesn’t show mean time to detect (MTTD) and mean time to respond (MTTR).
The Dashboard Delusion: Why Pretty ≠ Protective
I once watched a CISO proudly demo their “state-of-the-art” cybersecurity dashboard—glowing red alerts, animated firewalls, real-time globe spinning with “attacks.” Looks cool, right? Two weeks later, their AD domain got ransomwared because the dashboard never flagged anomalous Kerberoasting activity. It was tuned to detect port scans, not lateral movement.
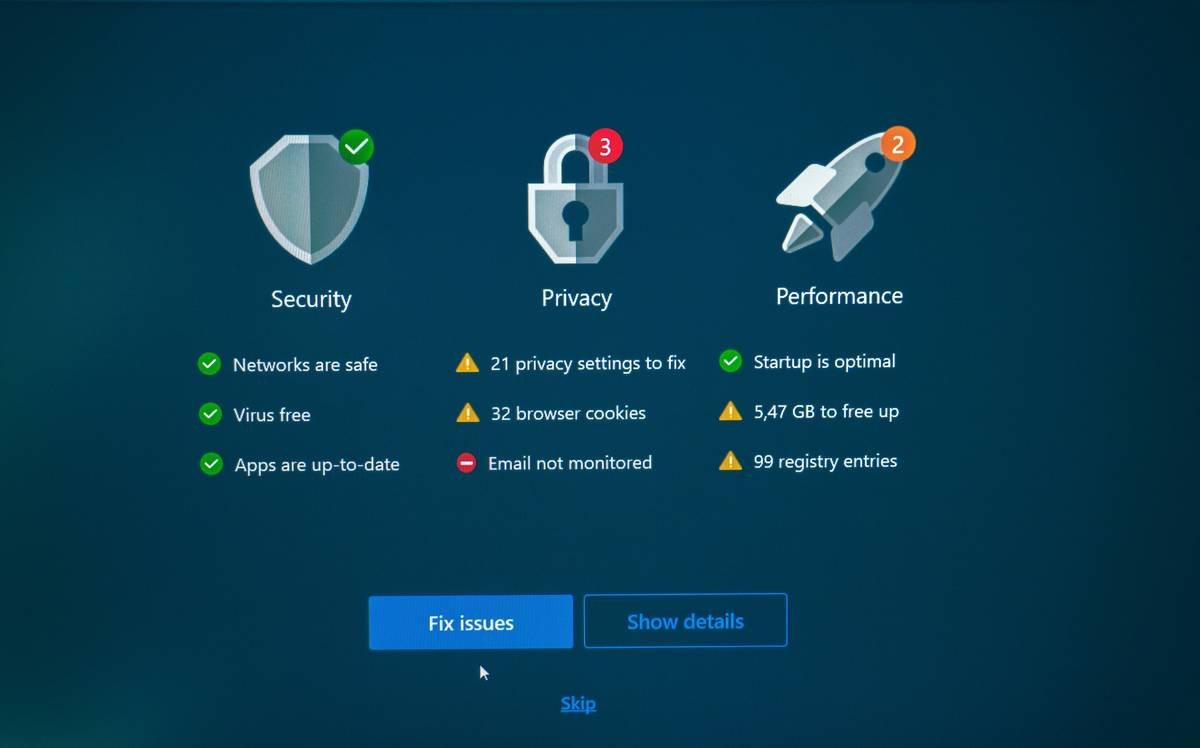
That’s the dirty secret: most cybersecurity dashboards measure activity, not risk. They track log volume, firewall hits, or IDS alerts—but ignore whether those signals correlate to actual business impact.
According to the SANS 2023 SOC Survey, 68% of security operations centers report spending over 30% of analyst time investigating false positives. Why? Because their dashboards lack contextual enrichment—like user roles, asset value, or MITRE ATT&CK technique mapping.
Optimist You: “Just add more alerts!”
Grumpy You: “Ugh, fine—but only if coffee’s involved… and even then, no. More alerts = more noise. Stop it.”
Building a Truthful Cybersecurity Dashboard: Step by Step
Step 1: Map Assets to Business Criticality
Not all servers are equal. Start by tagging assets with business impact levels (e.g., “Tier 1 = customer PII,” “Tier 3 = dev test box”). Your dashboard should weight alerts based on this hierarchy. A failed login on a Tier 1 database? Red alert. On a decommissioned VM? Gray noise.
Step 2: Integrate User and Entity Behavior Analytics (UEBA)
Baseline normal behavior per user role. If your CFO suddenly downloads 10GB of files at 3 a.m., that’s suspicious—even if it’s technically “allowed.” Tools like Microsoft Defender for Identity or Exabeam specialize in this.
Step 3: Embed Threat Intelligence Feeds
Link indicators of compromise (IOCs) from trusted sources like AlienVault OTX or Mandiant to your SIEM. But—critical—filter by relevance. Don’t just import every IP; correlate against your exposed services.
Step 4: Visualize Time-to-Respond Metrics
Your dashboard must show:
• Mean Time to Detect (MTTD)
• Mean Time to Respond (MTTR)
• Escalation rate (% of alerts needing human review)
If you can’t measure improvement, you’re flying blind.
Step 5: Automate Triage with Playbooks
Use SOAR (Security Orchestration, Automation, and Response) to auto-resolve low-risk events. Example: Automatically quarantine endpoints hitting known malware IPs. This frees analysts for true investigations.
Best Practices for High-Signal Security Views
Forget rainbow-colored charts that look like a toddler finger-painted your SOC war room. Here’s what actually works:
- Prioritize anomaly over volume. Show deviations from baseline, not raw log counts.
- Use MITRE ATT&CK Navigator overlays. Color-code techniques by kill chain phase (recon, execution, exfiltration).
- Enable drill-down without leaving the view. Click an alert → see raw logs, asset owner, patch status, and related tickets.
- Refresh dynamically. Static hourly snapshots miss fast-moving threats. Aim for sub-5-minute latency.
- Hide vendor logos. Seriously. Your dashboard isn’t a billboard for Splunk or Palo Alto.
Rant Section: Can we ban the phrase “real-time visibility”? Nothing in cybersecurity is truly real-time. Even AWS CloudTrail has 15-minute lag. Stop selling fairy tales.
Real-World Dashboard Disasters (and Wins)
Disaster: A Fortune 500 retailer used a dashboard that highlighted “most frequent alerts.” Top alert? Failed FTP logins. They ignored it as “background noise.” Turns out, attackers were brute-forcing a legacy FTP server hosting supplier invoices—leading to a $2M fraud scheme. The fix? Reclassified the server as Tier 1 and added geo-fencing.
Win: A healthcare provider integrated Epic EHR system logs with their cybersecurity dashboard. By correlating failed logins with patient record access patterns, they caught an insider threat: a nurse accessing celebrity records after hours. MTTR dropped from 72 hours to 22 minutes.
The difference? Context. One dashboard saw noise. The other saw narrative.
Cybersecurity Dashboard FAQs
What’s the difference between a SIEM dashboard and a cybersecurity dashboard?
A SIEM (Security Information and Event Management) is the backend engine that collects and correlates logs. A cybersecurity dashboard is the frontend visualization layer—ideally tailored to specific roles (analyst, CISO, IT admin).
How many metrics should my dashboard display?
Fewer than you think. Focus on 5–7 KPIs max: MTTD, MTTR, unresolved high-sev alerts, coverage gaps (unmonitored assets), phishing click rate, patch compliance %, and threat intel match rate.
Can I build one without a SIEM?
Yes—but with limits. Open-source tools like Wazuh + Grafana can create lightweight dashboards for SMBs. However, you’ll lack advanced correlation and automation. For <$50K/year budgets, consider cloud-native options like Microsoft Sentinel.
Terrible Tip Disclaimer:
“Just mirror your MSP’s default dashboard!” Nope. Managed service providers often use generic views that ignore your unique attack surface. Customize or compromise.
Conclusion
Your cybersecurity dashboard shouldn’t just look impressive—it should tell the truth. Strip away the fluff. Anchor every widget to business risk. Measure what matters: detection speed, response efficacy, and attacker dwell time. Remember, a silent dashboard isn’t secure—it might just be blind.
Start small: pick one Tier 1 asset, map its normal behavior, and build a single-pane view around its protection. Iterate. Refine. And for the love of zero trust, stop trusting red alerts that don’t explain why they’re red.
Like a Tamagotchi, your cybersecurity dashboard needs daily care—or it dies quietly while you’re distracted by shiny new tools.
Logs whisper,
Dashboards shout lies—
Truth hides in baselines.