Most companies think they’re protected. They run quarterly audits, install endpoint detection, and patch vulnerabilities—yet breaches keep happening. The problem? Static defenses can’t map dynamic attack surfaces. Enter the cybersecurity heatmap: a live, visual overlay of risk intensity across your digital footprint. Without it, you’re navigating a minefield with a flashlight.
Why Traditional Risk Assessments Fail Miserably
Legacy threat reports are snapshots—frozen in time the moment they’re printed. Meanwhile, attackers pivot every 12 minutes on average. Firewalls don’t show lateral movement. SIEM logs drown analysts in noise. And compliance checklists? They measure paperwork—not posture.
And here’s the brutal truth: if your security team isn’t visualizing threats spatially and temporally, you’re reacting—not preventing.
Building an Actionable Cybersecurity Heatmap
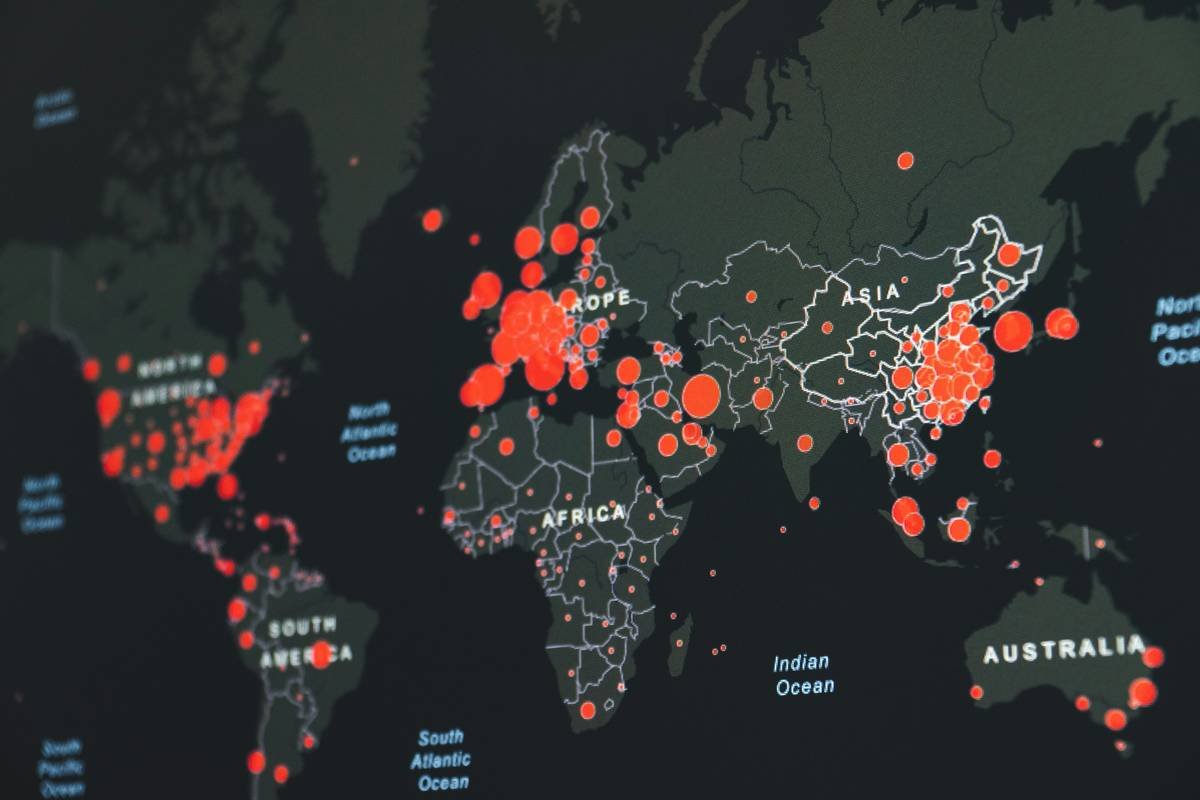
A real-time heatmap isn’t just pretty colors. It fuses network telemetry, identity behavior, cloud config drift, and dark web chatter into a single risk surface. Here’s how mature teams do it:
Step 1: Aggregate Multi-Source Telemetry
Pull data from EDR, cloud APIs, DNS logs, and IAM systems—not just your firewall. Normalize timestamps and asset tags. Garbage in = false confidence out.
Step 2: Weight by Exploit Likelihood & Business Impact
Not all red zones matter equally. A vulnerable dev server in AWS might score lower than an exposed HR database holding PII. Apply dynamic scoring based on CVSS, asset criticality, and attacker TTPs observed in recent campaigns.
Step 3: Visualize Geospatially + Temporally
Overlay risk hotspots on network diagrams or cloud architecture maps—and add a timeline slider. Suddenly, you see that spike in anomalous logins from Southeast Asia isn’t random—it aligns with a credential leak dumped 48 hours ago.
| Approach | Data Latency | Risk Coverage | Team Skill Required | Cost (Annual) |
|---|---|---|---|---|
| Static Vulnerability Scans | 7–30 days | Surface-level only | Junior analyst | $5K–$15K |
| SIEM-Based Alerts | Minutes–hours | Log anomalies only | Mid-level SOC | $50K–$200K |
| Real-Time Cybersecurity Heatmap | Seconds–minutes | Network, cloud, identity, threat intel | Threat hunter + data engineer | $120K–$500K+ |

The Industry Secret No Vendor Wants You to Know
Here’s the reality: most “heatmaps” sold by big-name platforms are just repackaged dashboards with color gradients—no predictive layer. But elite incident responders build a behavioral baseline heatmap. They don’t just track where attacks occur—they model where they shouldn’t be possible… then watch for violations. For example: if your finance team never accesses R&D servers, but the heatmap shows persistent low-level traffic between those segments at 3 a.m., that’s not noise—it’s tunneling. The math is simple: reduce false positives by anchoring visuals to expected behavior, not just raw alerts.
Frequently Asked Questions
What data sources feed a cybersecurity heatmap?
EDR telemetry, cloud configuration APIs, IAM logs, DNS queries, network flow data, and verified threat intelligence feeds—all normalized and correlated in real time.
Can small businesses afford this?
Not the enterprise version—but open-source stacks like Wazuh + Grafana + MITRE ATT&CK Navigator can create lightweight heatmaps under $10K/year.
How often should the heatmap update?
Critical layers (like authentication anomalies) should refresh every 15–60 seconds. Non-critical config drift can update hourly.